|
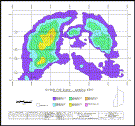
Below are examples of TECHBASE
cross sections. Many options are available, including cross,
top and side views; down hole data plotted as histograms, traces,
values or a combination; full control of front and back distance,
dip of section and endpoints; ability to combine multiple sections
into fence diagrams; font, color and size control of text; surveyed
or unsurveyed holes; plot blocks or surfaces from TECHBASE
models onto cross-sections.
|
|
Outstanding Section Capabilities |
|
TECHBASE quite simply sells one of the best cross section
programs in the industry. Our formats are flexible and offer
a wide range of choices for plotting and viewing your down hole
data. This section shows the cross, side and top views. Turn
these views on or off as needed. |

|
|
Flexible
Formats |
|
The flexibility of the TECHBASE
section program becomes apparent in this cross section. TECHBASE
can contour cross sections through a method of switching coordinate
systems during section plots. This technique, and many other
TECHBASE technical issues is described in our TECHBASE
Technote series - free to all customers under current support. |

|
|
Vertical Exaggeration |
|
Some data can only be illustrated
using strong vertical exaggeration. With TECHBASE you can
set options such as scale, grids, and exaggeration. |

|
|
Correlation Tools |
|
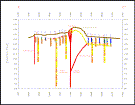
Use TECHBASE to correlate
drilled units. Detailed logs can be plotted to be used as correlation
tools as shown in this graphic. |

|
|
Plot Surfaces |
|
Modeled surfaces can be plotted
on your cross sections. Draw surface topography as modeled from
you XYZ data, or unit tops/bottom as shown in this illustration
of down hole data from an oil and gas project. |

|
|
Multiple Data Types |
|
Plot data as down hole traces, values,
histograms or all the above, then overlay surfaces and interpreted
correlation between units. Finally edit your data to add descriptions
to your graphic |

|
|
Surveyed or Unsurveyed Drill
Holes |
|
Plot data from vertical or inclined,
unsurveyed holes as shown in this section. Or, plot complex surveyed
down hole traces. TECHBASE built-in survey tools automatically
calculates drill hole inclination and plots it on your section. |

|
|
Underground Drilling |
|
Filter your data for ease in plotting
bench level drill holes as shown in this graphic. Filters also
allow you to restrict the type of data you plot and construct
just the diagram you want. |

|
|
Expansion
The inherent flexibility of TECHBASE
is what allows you to control exactly the diagram you want to
plot. You can add programs to model your data, then plot modeled
surfaces or blocks onto your cross sections. Our import/export
utilities allow you to freely exchange graphics with many programs,
including AutoCAD dxf format and universal graphics formats such
as Postscript file (.ps), CGM (.cgm), GIF (.gif) and others. |